Super Resolution Microscopy
Content
What is super resolution microscopy?[Edit]
Basic Description
Imaging has long been recognized as a crucial tool for understanding cellular structure and function. Diffraction has however limited light microscopy to a resolution of 200nm at best, leaving the observation of ultrastructural cellular features to the field of electron microscopy (EM). This includes cellular structures that contribute to cell motility, force generation and mechanosensing such as actin filaments, microtubules and focal adhesion complexes.Advances in optical techniques, broadly termed super-resolution fluorescence microscopy, together with advances in fluorescent labeling methods, have extended the resolving power of light microscopy towards the nano-scale, as is described in recent reviews [1, 2, 3, 4]. These advances make it possible to dissect the molecular architecture of cells without subjecting them to EM processing techniques.
Diffraction and the Point Spread Function
Diffraction is a manifestation of the wave properties of light. In a typical light microscope operating in the visible spectral range (400-700 nm) (see Figure below), diffraction determines the smallest focal volume that light can be focused into. This is referred to as the point spread function (PSF) and limits resolution to ~250 nm in the X-Y image plane and ~500 nm along the Z optical axis [2]. In other words, in conventional light microscopes such as confocal or TIRF (Total Internal Reflection Fluorescence), structural features lying closer to each other than the PSF length scale cannot be resolved. This limitation has however been over come with the development of various super resolution microscopy methods.
Stimulated Emission Depletion Microscopy[Edit]
For a typical fluorophore, the absorption of an excitation photon with an energy level between the fluorophore’s ground state level and excited state (S1), will cause the fluorophore to enter an excited state. The fluorophore subsequently loses energy through a process termed ‘vibrational relaxation’ over a timescale of picoseconds. This results in an energy level that is still excited but slightly lower than the initial excitation level.
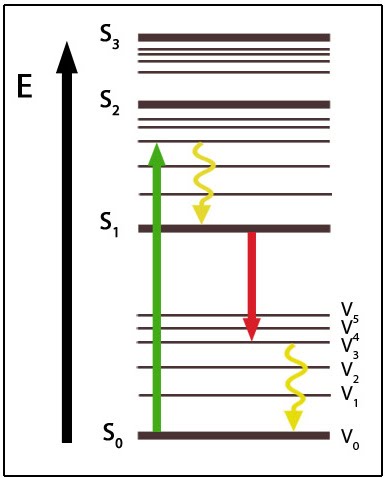 When exposed to standard radiation intensity conditions, the fluorophore will remain in its excited state for a few nanoseconds before emitting a fluorescent photon (spontaneous emission) and decaying back to its ground state. When the radiation field is of sufficiently high intensity, the excited state can be induced to emit a photon in resonance with the stimulating radiation field. This causes the fluorophore to return to its ground state immediately.
 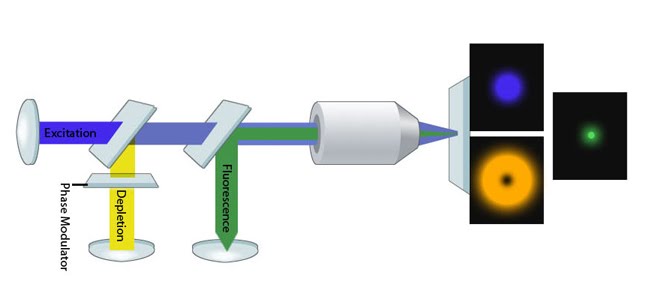 This phenomenon is exploited by a mode of super-resolution imaging known as STED (stimulated emission depletion) microscopy. It can be applied together with point-scanning confocal microscopy to improve spatial resolution, by reducing the effective size of the point spread function (PSF) [5]. In this case, the excitation beam is directed at the sample along with a de-excitation beam (also known as the STED beam), which forms a ring or doughnut around the focal point. The STED beam is slightly red-shifted along the spectral range.
 In STED microscopy, molecules at the focal point, or the center of the PSF are not affected by the STED beam and thus produce a spontaneous photon. Most of the molecules within the PSF are however exposed to the STED beam, meaning they undergo a stimulated emission and subsequently return to their ground state immediately. The higher the intensity of the STED beam, the more molecules will emit a stimulated photon as opposed to a spontaneous photon. This method ensures the fluorescence signal collected from spontaneous emission is due only to those molecules in the much smaller central area that is not exposed to the STED beam. With a smaller effective PSF, the sample can be imaged in a confocal geometry with higher spatial resolution [5].
Structured Illumination Microscopy (SIM)[Edit]
Wide-field based microscopy has also been adapted in various super-resolution microscopy methods. One such example is, structured illumination microscopy (SIM), which relies on the use of well-defined excitation patterns to excite fluorophores throughout the entire sample [3, 6].
In order to obtain higher spatial frequency information than standard microscopy (that is, to image at higher spatial frequencies than the diffraction boundary would normally permit), SIM introduces sharp spatial patterns in the excitation beam. For example; through use of a uniform striped mask or grating. The observed emission is the product of two patterns; the known pattern, which is a result of local excitation light intensity produced by the sharp spatial excitation patterns, and the unknown pattern that results from the fluorophore density. Frequency mixing of these patterns move normally unresolvable information into the passband of the microscope and post-processing, where appropriate, can result in a resolution-doubled image [6].
Multiple images are captured using this method with the pattern rotated at a fixed interval for each new image. These images are reconstructed through computation into a single image by specialized software, allowing the creation of a super-resolved image with approximately a 2x increase in resolution [6].
Localization Microscopy[Edit]
Another common approach for super-resolution depends upon the ability to isolate, detect and image individual fluorophores. This method is applied in several microscopy set-ups including; PALM (Photo-Activated Localization Microscopy)[7], FPALM (Fluorescence Photo-Activated Localization Microscopy) [8, 9], STORM (Stochastic Optical Reconstruction Microscopy)[10], GSDIM (Ground State Depletion and Individual Molecular Return Microscopy)[11] and other derivatives thereof. It relies on photoswitching or photoactivation characteristics of the fluorescent molecules.
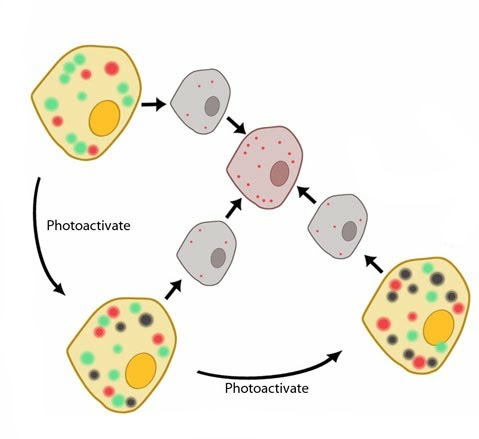 Most ordinary fluorophores typically follow 2-state energy level diagrams. During fluorescence imaging the emission originates from the entire population of fluorophores and produces a diffraction-limited image – since molecules closer together than the PSF length scale will strongly overlap with neighboring molecules [1]. Photoactivatable fluorophores, on the other hand, have more complex photophysical characteristics. In general, upon absorption of an activating photon, these fluorophores can alter their emission characteristics e.g. from inactive to active states or from one spectral range to another, such as green emitting to red emitting. Through careful control of the photoactivation light, it is possible to photoconvert a small subpopulation of fluorophores at a given time. Using the appropriate fluorescence detection channel, these photoconverted fluorophores can be spectrally resolved from the inactive pool, allowing the emission of individual fluorophores to be detected.
During localization microscopy techniques, continuous and asynchronous cycles of photoactivation, imaging and photobleaching can be recorded by a highly sensitive electron-multiplying CCD camera (see ‘Figure: iPALM microscope schematic’ at bottom). Under typical imaging conditions, a photoconverted molecule will stay active (i.e. visible) for at most several seconds, before photobleaching. By processing tens of thousands of these bleaching events, the coordinates of molecules can provide sufficiently dense spatial coverage of the structure of interest. The super-resolution image can therefore be reconstructed from these coordinates.
Although the image of each single fluorophore is diffraction-limited, by computing the centroid of the diffraction-limited image, it is possible to precisely localize the position of the center of the molecule, an approach termed ‘localization analysis’. This is typically achieved by fitting the observed single molecule image with a 2-dimensional Gaussian function, thus allowing the spatial position of the molecules to be determined with a resolution an order of magnitude better than the diffraction limit, i.e. down to a few tens of nanometers or better, dependent on the brightness of the fluorophores.
Most ordinary fluorophores typically follow 2-state energy level diagrams. During fluorescence imaging the emission originates from the entire population of fluorophores and produces a diffraction-limited image – since molecules closer together than the PSF length scale will strongly overlap with neighboring molecules [1]. Photoactivatable fluorophores, on the other hand, have more complex photophysical characteristics. In general, upon absorption of an activating photon, these fluorophores can alter their emission characteristics e.g. from inactive to active states or from one spectral range to another, such as green emitting to red emitting. Through careful control of the photoactivation light, it is possible to photoconvert a small subpopulation of fluorophores at a given time. Using the appropriate fluorescence detection channel, these photoconverted fluorophores can be spectrally resolved from the inactive pool, allowing the emission of individual fluorophores to be detected.During localization microscopy techniques, continuous and asynchronous cycles of photoactivation, imaging and photobleaching can be recorded by a highly sensitive electron-multiplying CCD camera (see ‘Figure: iPALM microscope schematic’ at bottom). Under typical imaging conditions, a photoconverted molecule will stay active (i.e. visible) for at most several seconds, before photobleaching. By processing tens of thousands of these bleaching events, the coordinates of molecules can provide sufficiently dense spatial coverage of the structure of interest. The super-resolution image can therefore be reconstructed from these coordinates.
Although the image of each single fluorophore is diffraction-limited, by computing the centroid of the diffraction-limited image, it is possible to precisely localize the position of the center of the molecule, an approach termed ‘localization analysis’. This is typically achieved by fitting the observed single molecule image with a 2-dimensional Gaussian function, thus allowing the spatial position of the molecules to be determined with a resolution an order of magnitude better than the diffraction limit, i.e. down to a few tens of nanometers or better, dependent on the brightness of the fluorophores.
Imaging in 3D[Edit]
The super resolution microscopy methods discussed above have been applied to 3D imaging studies. To optimize image quality however, several factors associated with the added dimension (Z-axis or axial dimension) must first be overcome. Some of these factors include:
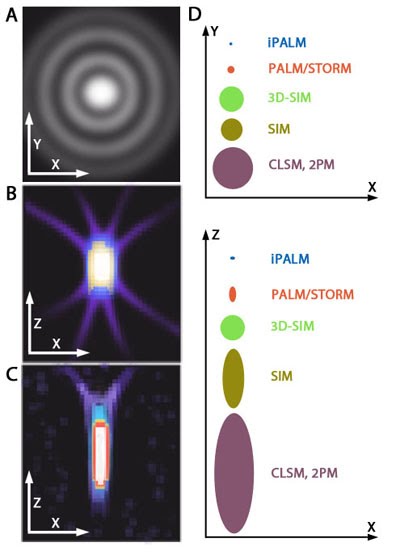 Reduced resolution: Imaging along the Z-axis (axial dimension) is associated with significantly lower resolution compared to the planar, X-Y axis (lateral dimension). This is related to the shape of the PSF, which will appear stretched or elongated when plotted in an X-Z projection (see ‘Figure: PSF elongation along the z axis).
Increased working distance: Reduced resolution is confounded by the distance of structures from the front element of the objective lens. As structures get deeper into the cell body so must the working distance from the lens, which leads to optical aberrations as well as sample induced scattering.
Non-specific fluorescence: Both the illumination beams used in fluorescence methods and the fluorescent emission from fluorophores interact with biological samples, producing background signals.
Time of fluorophore exposure: Multiple images of single regions of a cell must be captured. This not only slows down the experimental process but promotes photobleaching of fluorophores, phototoxicity and may prevent effective 4D imaging (time course imaging, live cell tracking etc)
Various methods to overcome these potential obstacles in 3D imaging have been applied to each super-resolution microscopy method.
Reduced resolution: Imaging along the Z-axis (axial dimension) is associated with significantly lower resolution compared to the planar, X-Y axis (lateral dimension). This is related to the shape of the PSF, which will appear stretched or elongated when plotted in an X-Z projection (see ‘Figure: PSF elongation along the z axis).Increased working distance: Reduced resolution is confounded by the distance of structures from the front element of the objective lens. As structures get deeper into the cell body so must the working distance from the lens, which leads to optical aberrations as well as sample induced scattering.
Non-specific fluorescence: Both the illumination beams used in fluorescence methods and the fluorescent emission from fluorophores interact with biological samples, producing background signals.
Time of fluorophore exposure: Multiple images of single regions of a cell must be captured. This not only slows down the experimental process but promotes photobleaching of fluorophores, phototoxicity and may prevent effective 4D imaging (time course imaging, live cell tracking etc)
Various methods to overcome these potential obstacles in 3D imaging have been applied to each super-resolution microscopy method.
An in-depth example of super resolution microscopy: iPALM[Edit]
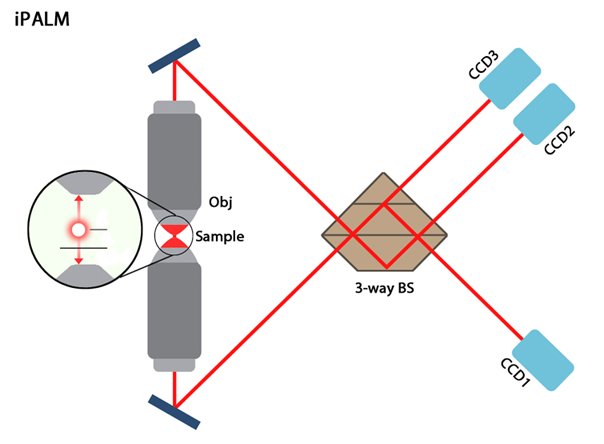
This enhancement is achieved when photons are emitted following fluorophore excitation and travel through both objective lenses. The two signals are recombined using a 3-way beam splitter which causes self-interference of the photons and produces three beams of varying intensities which are subsequently detected by CCD cameras [1].
Axial localization of the fluorophore can be established, as the length of the path the photons must travel is directly proportional to the location along the Z-axis of the fluorophore that emitted them. Each emitted photon travels through both the top and bottom paths, but the effective length of each path differs based on the axial position of the fluorophore. The self-interfered photon thus results from the combination of two waves with a slight shift in phase. This phase shift is directly proportional to the axial position and can be projected onto the camera through the 3-way beamsplitter. The 3-way beamsplitter is a phase-sensitive projection system, whereby each output beam has a mutual phase difference of 120 degree [1].
Due to opposing objective lenses, sample sizes must be less than 15-20 µm thick. Despite this limitation, iPALM not only provides an axial resolution that is two-fold better than the lateral resolution, but it is highly accurate, capable of axial localizations of up to 10 nm [12].
iPALM in Mechanobiology[Edit]
Focal adhesion proteins are stratified along the axial dimension
Despite being in its infancy, iPALM technology has already contributed to the field of mechanobiology. It has been used to define the ultrastructure of focal adhesions [13]; a feat that neither electron microscopy nor 2D-super resolution microscopy had been able to achieve.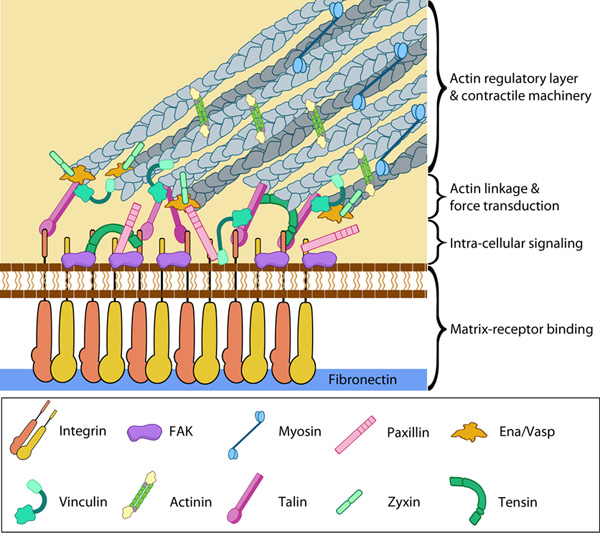 These findings definitively confirmed that integrins and actin filaments do not directly interact and are instead separated by a space of approximately 40 nm. Bridging this gap is a ‘focal adhesion core’, containing a number of proteins arranged in distinct layers that are interdependent in their functionality [13]. For example, focal adhesion kinase and paxillin are positioned close the plasma membrane and in direct contact with integrin, which is consistent with their role in integrin-mediated signaling. Cytoskeletal adaptors such as vinculin and zyxin were found to be distributed at greater depths from the coverslip, above the integrin signaling proteins in a Z-plane corresponding to the lower boundary of the actin filament layer. According to iPALM results approximately 50% of the vinculin molecules overlapped with actin filaments, whilst the remaining amount was located lower in the focal adhesion core, corresponding to a role in the regulation of force transmission within the focal adhesion. Zyxin and VASP localized at a similar depth along the Z-axis, where they overlapped with the lower boundary of actin. This localization therefore implicated these proteins in the cooperative regulation of actin assembly – a role that had previously been attributed to them [14].
Talin, a protein that is involved in the initiation of integrin-mediated adhesion and force transmission within focal adhesions, was imaged with the fluorescent probe tagged at different sites (N- and C- terminals). This revealed a polarized arrangement within the focal adhesion core, where the talin head (N-tag) was distributed near the plasma membrane along with focal adhesion kinase, paxillin and integrin. The tail region of talin (C-tag) was consistently localized 30nm away from the head along the Z-axis, overlapping with the distribution of zyxin, VASP and actin. This arrangement revealed a vertical scaffolding function of talin, where the protein may span the entire focal adhesion core possibly creating a direct link between integrin and actin [13].
This detailed description of focal adhesion architecture obtained through iPALM technology not only revealed a highly consistent stratification of proteins, but has provided additional evidence for how mechanical force may shape focal adhesion formation and maintenance. The localization of talin as a stretchable tether spanning the focal adhesion core is particularly relevant, as this protein may shape focal adhesion architecture through protein recruitment in response to mechanically induced stretch [13] .